How To: Create a CeFi crisis dashboard
Objective & Benefit
Sometimes we see a centralized ('CeFi') exchange or wealth management entity in the news, with reports of wrongdoing or mass withdrawals. But as an observer it's hard to know if there is any merit to the news or if it's just FUD.
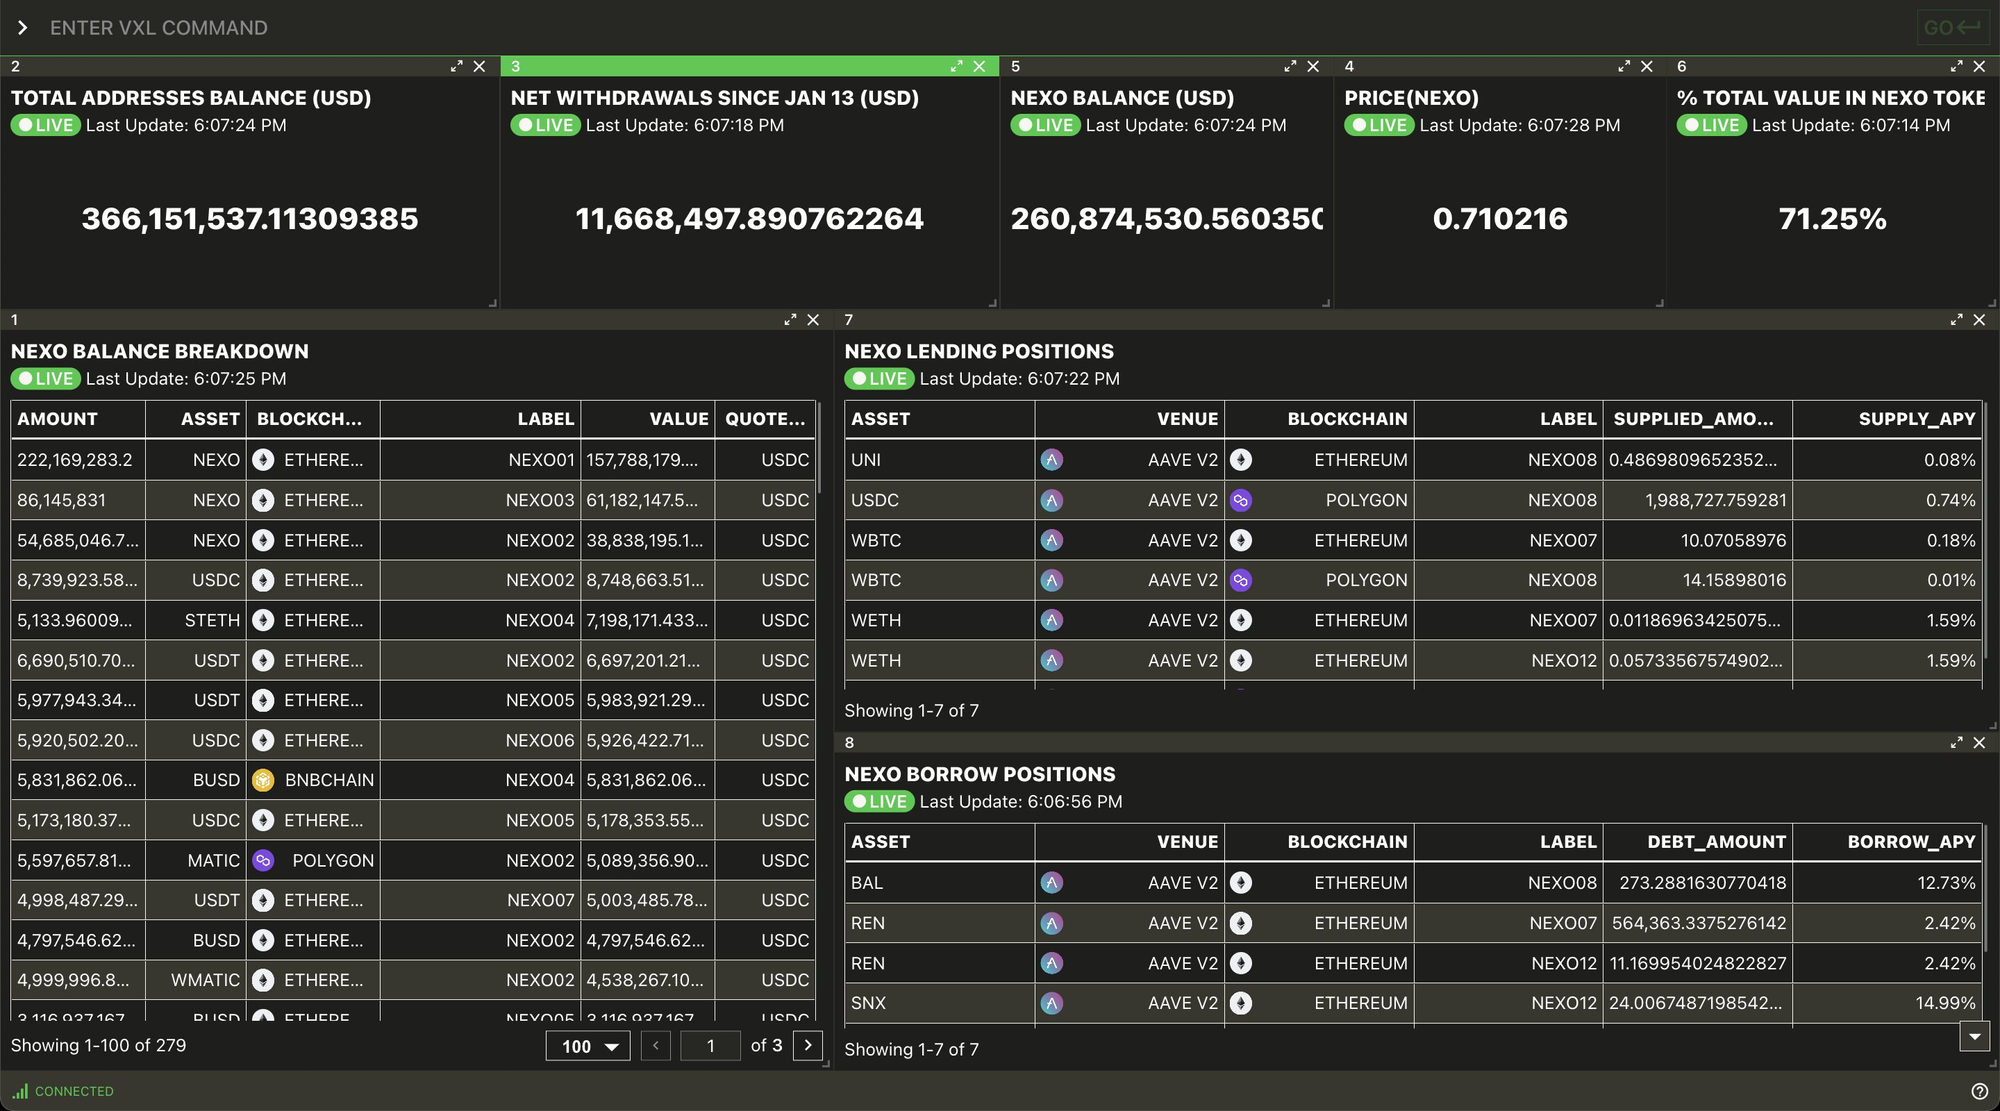
We're going to show you how to use Vektor to easily whip up a live-updating crisis dashboard like this one below, so you can easily see for yourself what's going on, and stop relying on information in the news and/or social media. Starting with just a list of known addresses belonging to the entity, we can quickly see things like net withdrawals, % value in their own token, and even lend/borrow positions using just a couple of VXL functions.
Functions used
LABELS.ADD - Add a human readable label to a blockchain addressBALANCES - Get the balances for all assets on all blockchains for all labelled addressesBALANCES.SUM - Sum the balances for all on all blockchains for all labelled addressesPRICE - Get the price of an assetLEND.POSITIONS - Get info on supplied lending positionsBORROW.POSITIONS - Get info on borrowed positions
Step-by-step
1. Add labels for all the addresses associated with the CeFi entity
Use LABELS.ADD to register all the known on-chain addresses associated with Nexo. In this case we sourced the addresses from a spreadsheet found online.
Shift+Enter to move to a new line without submitting the command.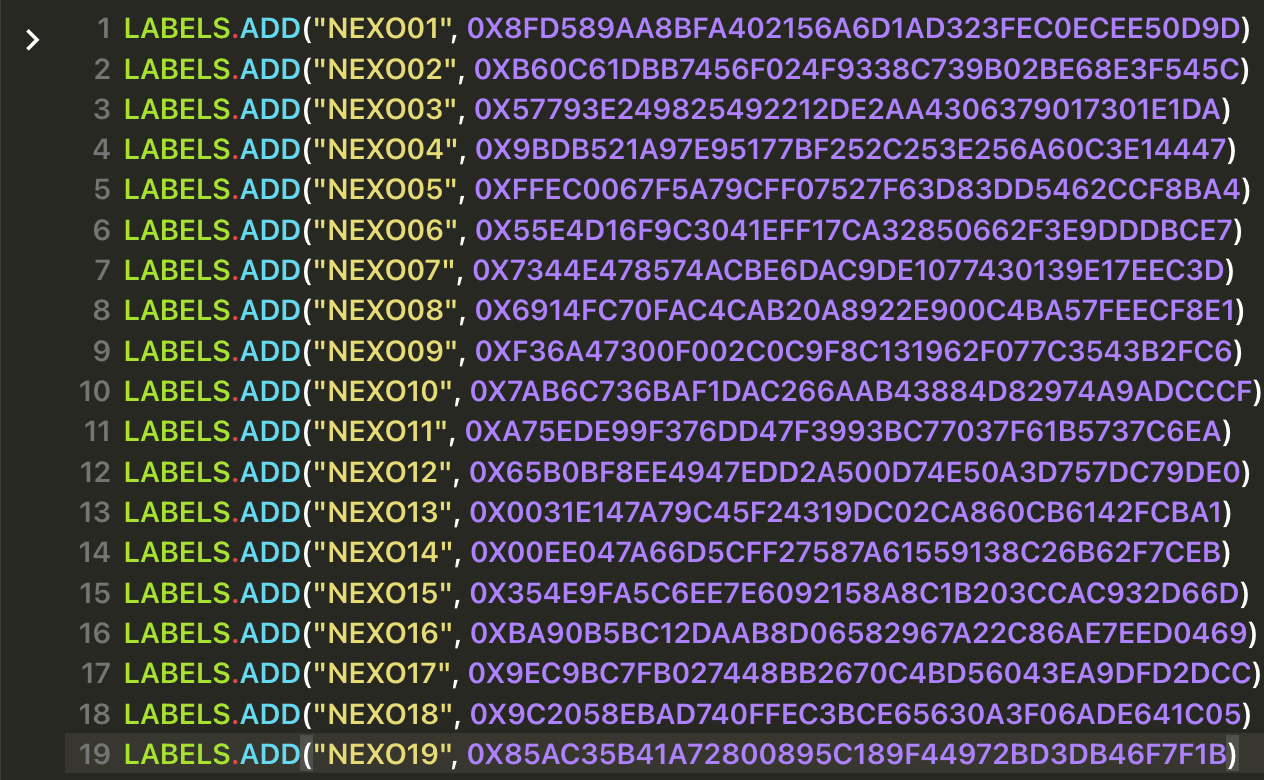
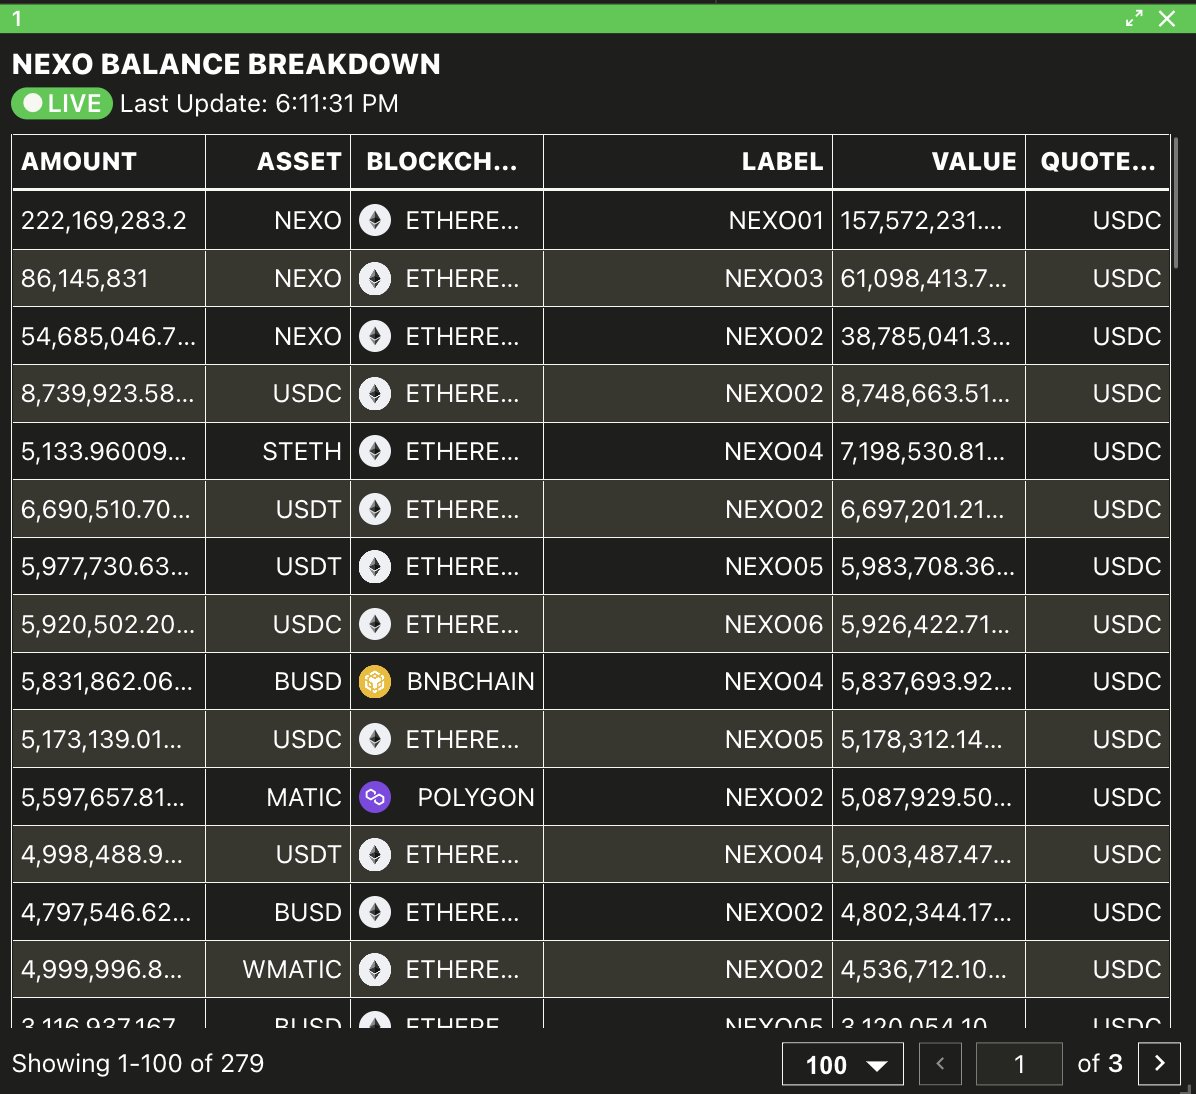
2. See a global breakdown of assets using BALANCES
Now that we have added the LABELS, simply run BALANCES to see a breakdown across all assets, chains, and labelled addresses. We can see that the top few balance items are all in the NEXO asset.
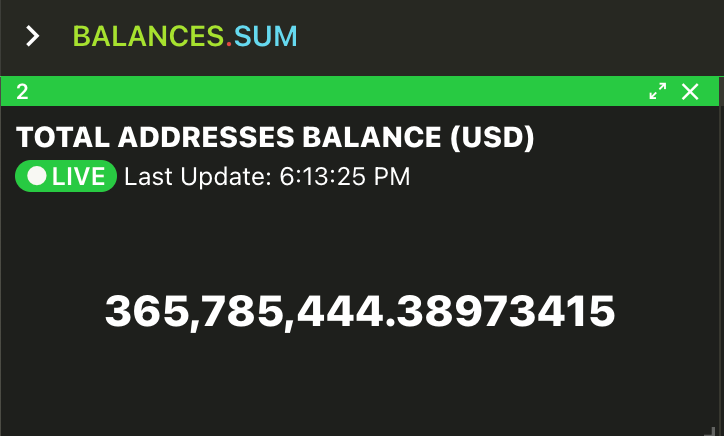
3. See a total balance using BALANCES.SUM
You can see the total balance using BALANCES.SUM. Vektor will live-convert all the individual assets (default USD) and sum the total.
We can see that there is ~$366m across all the known Nexo addresses.
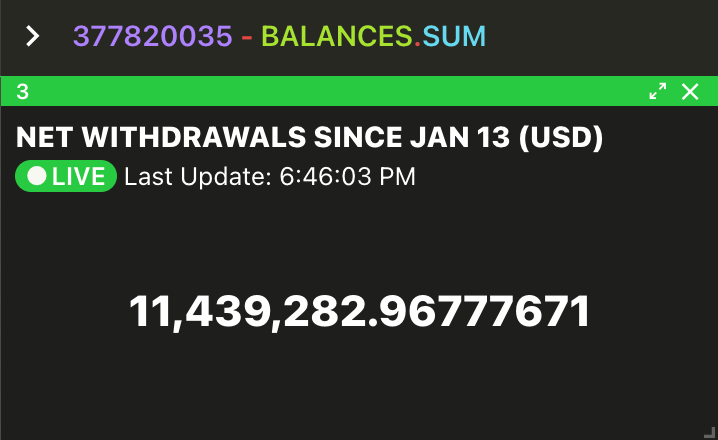
4. Calculate net withdrawals
We can use some simple arithmetic to subtract this figure from the known balance on Jan 13, to get a live-updating net withdrawals metric.
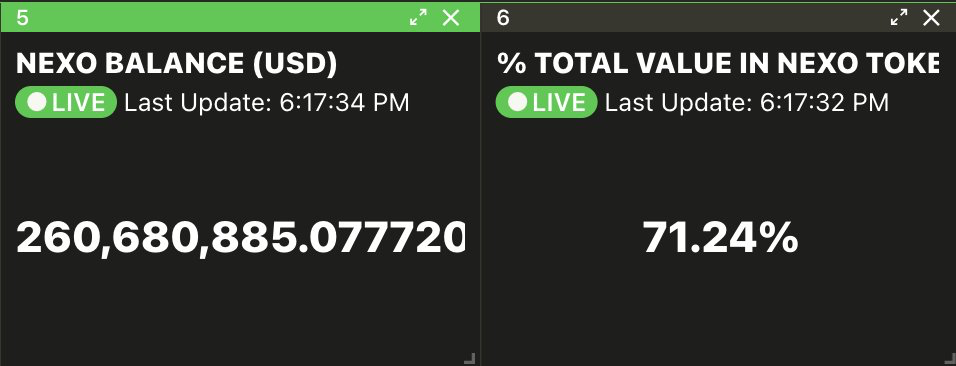
5. Breakout the entity token, and compute it's value as a % of the total
Remembering the FTX collapse, what started this crisis was the undermining of confidence of the exchange's native token, and it's relative weighting in the overall balance sheet.
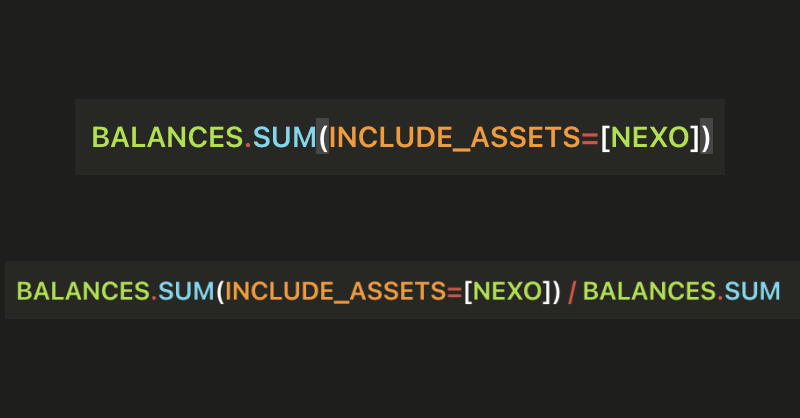
Focusing here on the NEXO asset, we can add an asset filter to BALANCES to see the total NEXO balance across these addresses (quoted in USD). Then it's just some simple arithmetic to show the % that NEXO value makes up of the total.
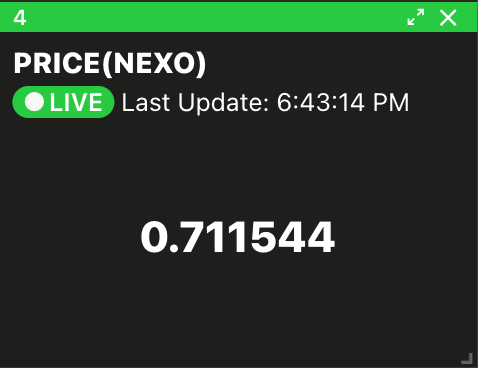
6. Add a PRICE feed
For good measure we add the NEXO price feed. Remember, everything so far is all live-updating, not just price!
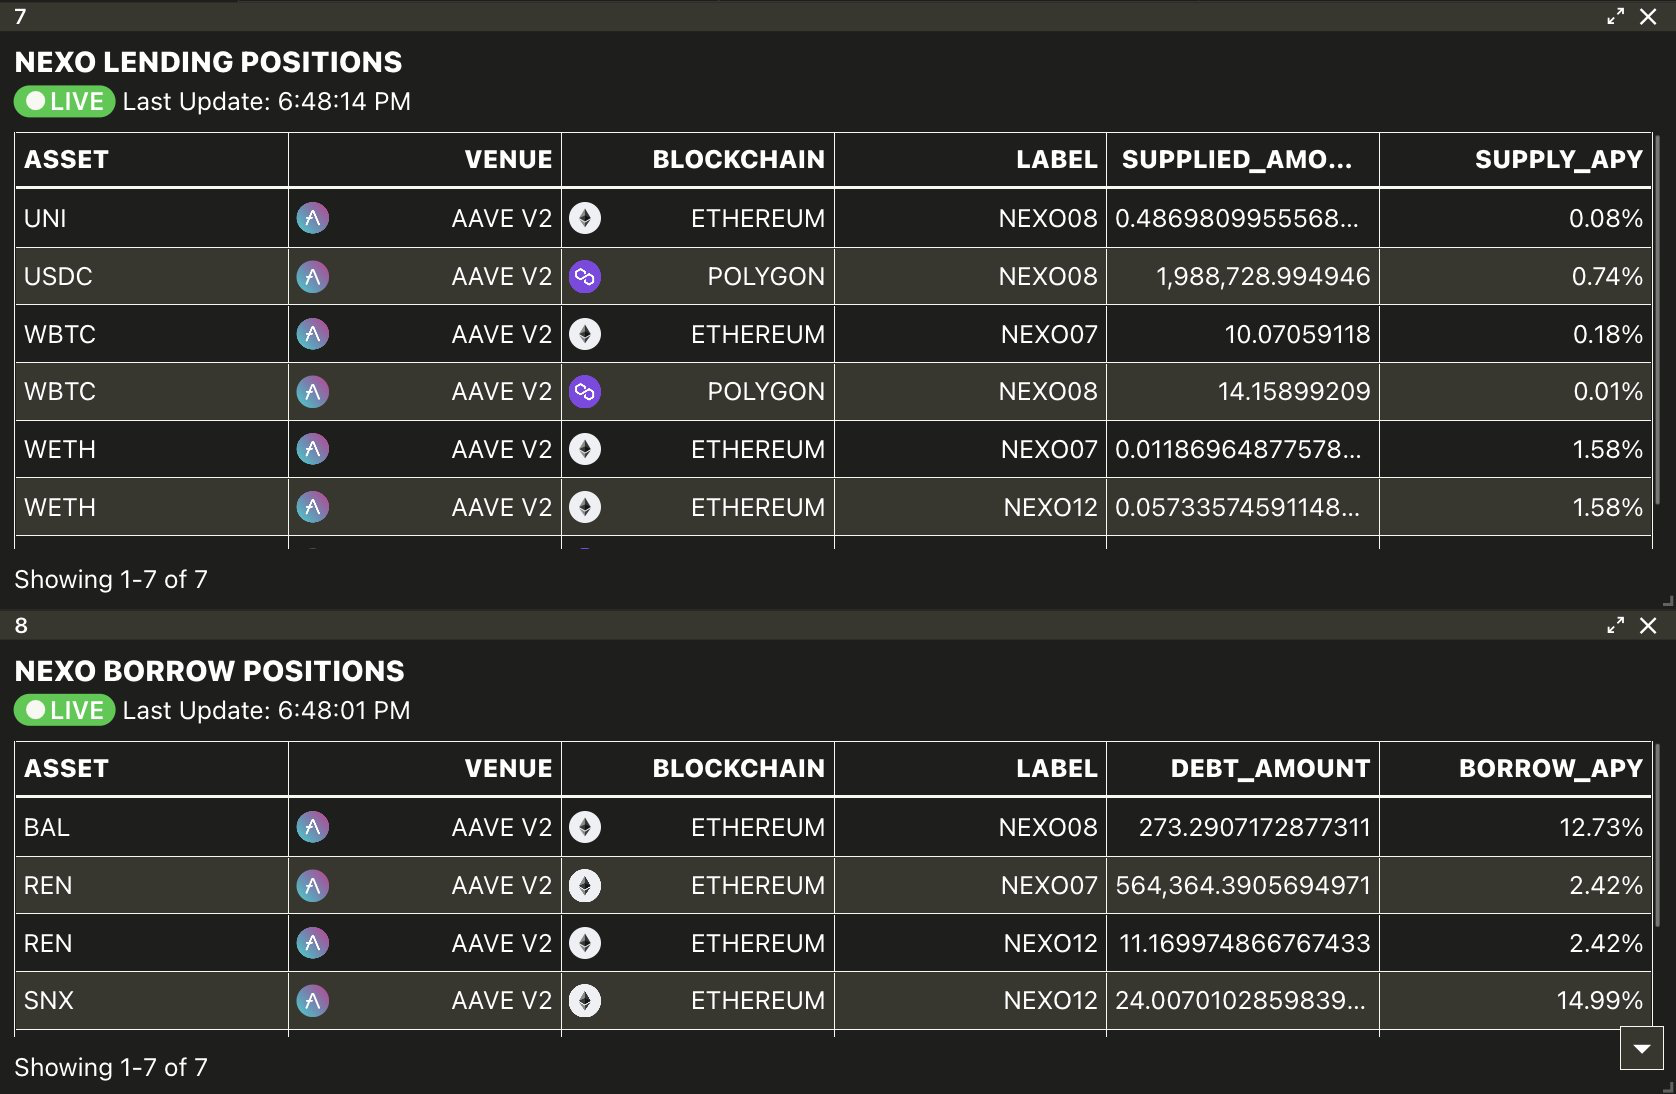
7. Search and display global LEND and BORROW positions
Finally, using Vektor's LEND.POSITIONS and BORROW.POSITIONS functions, we discovered that Nexo has 7 lend and 7 borrow positions on Aave on Ethereum and Polygon. They are also LP'ing on Curve Finance (using LP.POSITIONS - not shown here).
8. Arrange the WORKSPACE layout
A bit of layout tweaks and we have our dashboard on all-things Nexo. Now we can watch all of our metrics, some direct and some derived, and get a much better picture of what's going on.
Hope you liked this How-To use-case! You can find more here.
Read more:
- News: Vektor launches Live Updates!
- How To: Find out where all your ETH is using BALANCES
- Explainer: What is VXL
- More How-To's