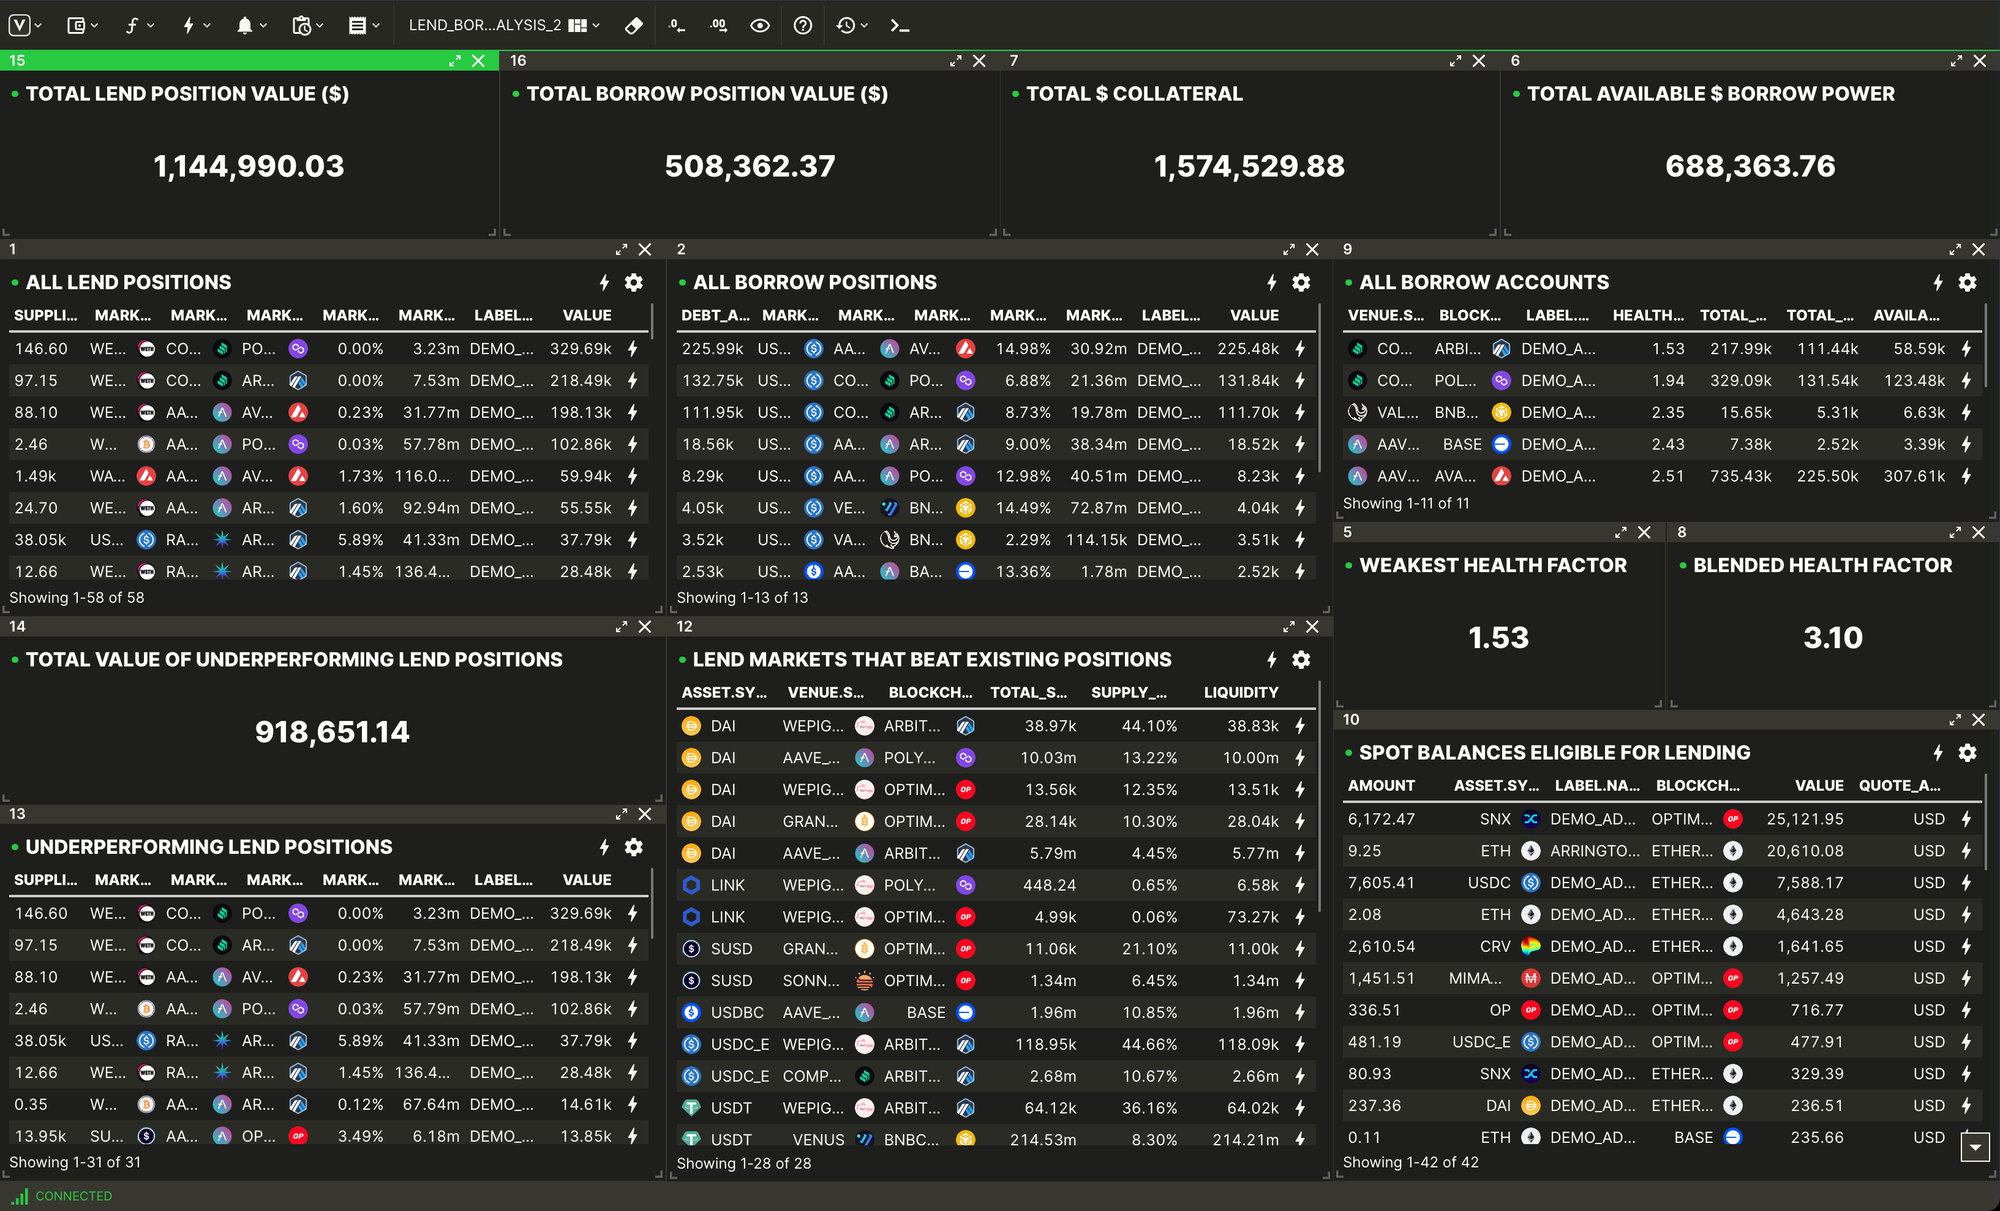
Template Spotlight 🔦: Lend/Borrow Positions Layout

Since launching the Layout Templates functionality in Vektor, we've been working hard to bring you some great examples of layouts you can build in Vektor. In this post we're going to cover a great example of what's possible: the Lend/Borrow Positions Analysis template.
This layout displays details on lend/borrow positions, and highlights underperformance. You should find this as a default when you login to Vektor, or you can easily add it from the Layout Templates Library. Read how here.
Let's go though each component, explain what is is, and show you how you could recreate it using VXL code. There's some pretty powerful functionality further down!
All Lend Positions
This is a list of all your lend positions in DeFi (i.e. all the assets that you've lent to single-asset markets like Aave, Curve, etc.). By default Vektor checks all supported venues, assets, and chains across all the addresses that you've labelled.
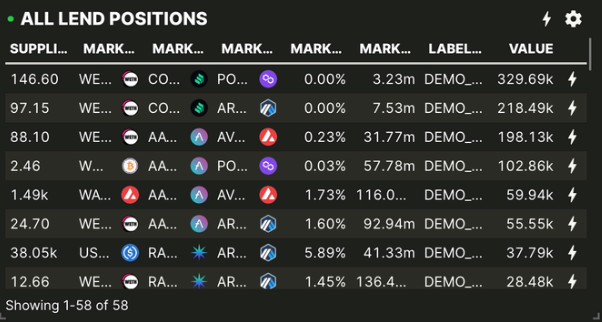
You can easily created this component using the App Toolbar (Functions > Onchain > Lend > Positions) or by directly typing LEND.POSITIONS into the command line.
Total Lend Position Value ($)
This is the sum of all the values of all the lend positions of all your labelled addresses (across all supported blockchains and venues).
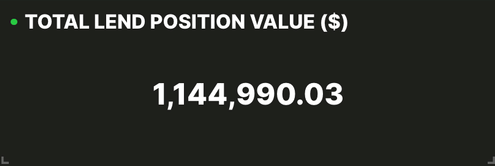
This is a single metric that is derived from the LEND.POSITIONS table, first by extracting the VALUE column then using SUM to get the total:
SUM(COLUMN(LEND.POSITIONS, "VALUE"))
All Borrow Positions
Similar to 'All Lend Positions', this is a list of all your borrow positions in DeFi. By default Vektor checks all supported venues, assets, and chains across all your labelled addresses and puts them in one list.
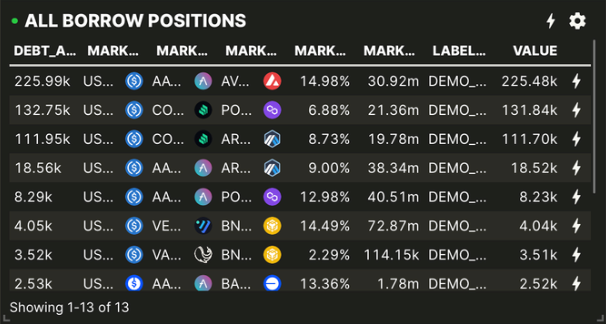
You can easily created this component using the App Toolbar (Functions > Onchain > Borrow > Positions) or by directly typing BORROW.POSITIONS into the command line.
Total Borrow Position Value ($)
This is the sum of all the values of all the borrow positions of all your labelled addresses (across all supported blockchains and venues).

Similar to the above, this is a single metric that is derived from the BORROW.POSITIONS table, first by extracting the VALUE column then using SUM to get the total:
SUM(COLUMN(BORROW.POSITIONS, "VALUE"))
All Borrow Accounts
Some lend/borrow metrics are aggregated at the account level (e.g. in Aave your borrowing power depends on the health of all your various lend/borrow positions). For this we use the Borrow Accounts component.
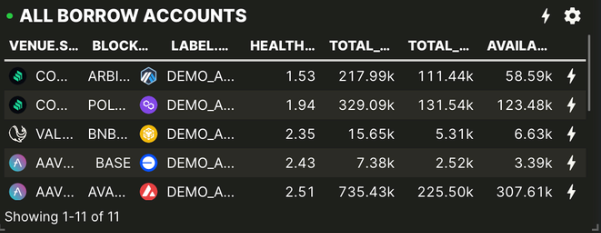
You can create this component using the App Toolbar (Functions > Onchain > Borrow > Accounts) or by directly typing BORROW.ACCOUNTS into the command line.
Total $ Collateral
This is the total value of assets counting towards your collateral across all your borrowing accounts.

This is a single metric that is derived from the BORROW.ACCOUNTS table, first by extracting the TOTAL_COLLATERAL column then using SUM to get the total:
SUM(COLUMN(BORROW.ACCOUNTS, "TOTAL_COLLATERAL"))
Total Available $ Borrow Power
This is the total amount you can borrow based on the health of your borrow accounts. Default unit is dollars.

This is a single metric that is derived from the BORROW.ACCOUNTS table, first by extracting the AVAILABLE_BORROW column then using SUM to get the total:
SUM(COLUMN(BORROW.ACCOUNTS, "AVAILABLE_BORROW"))
Weakest Health Factor
This is the lowest health factor (ratio of total collateral to total debt) across all your borrow accounts. It's a great metric because it tells us how close our most at-risk account is to liquidation (i.e. this is the one to focus on; everything else is in better health).

Still using the BORROW.ACCOUNTS table, we first extract the HEALTH_FACTOR column then using the MIN column function to compute the lowest.
MIN(COLUMN(BORROW.ACCOUNTS, "HEALTH_FACTOR"))
Blended Health Factor
Same as above but instead of computing the Minimum health factor, we compute the Average.
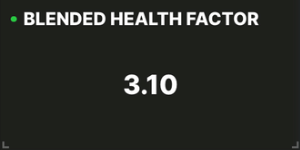
AVERAGE(COLUMN(BORROW.ACCOUNTS, "HEALTH_FACTOR"))
Underperforming Lend Positions
This is where we really start to showcase the true power of Vektor's composable expressions. We show a list of all your 'underperforming' positions which are positions that aren't getting the highest APY for this particular asset. If this component has any data at all, it shows that you are leaving money on the table!
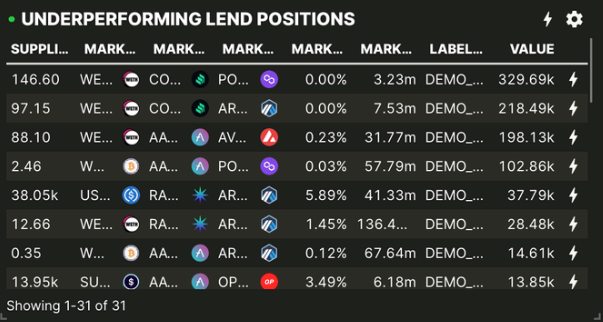
To do this we
- First search and find all your lend positions across all chain, venues, and addresses
- Next, extract a list of your position assets and query a complete list of all the lend markets for those assets (in this case we assume same chain / no bridging)
- Using the FILTER function, we filter the list from (1.) above to only show lend positions where an alternative market exists with a better
SUPPLY_APY.
FILTER(LEND.POSITIONS, VAL.MARKET.SUPPLY_APY < LIST.FIRST(LEND.MARKETS(INCLUDE_ASSETS=[VAL.MARKET.ASSET], INCLUDE_BLOCKCHAINS=[VAL.MARKET.BLOCKCHAIN]).SUPPLY_APY))
Total Value Of Underperforming Lend Positions
This is the total value of all the lend positions that are not deployed in the optimum lend markets. It's a metric that represents underperforming capital.

From the exotic list above, we simply extract the VALUE column and then use the SUM function to compute the total:
SUM(COLUMN(FILTER(LEND.POSITIONS, VAL.MARKET.SUPPLY_APY < LIST.FIRST(LEND.MARKETS(INCLUDE_ASSETS=[VAL.MARKET.ASSET], INCLUDE_BLOCKCHAINS=[VAL.MARKET.BLOCKCHAIN]).SUPPLY_APY)), "VALUE"))
Lend Markets That Beat Existing Positions
Remember above we queried a complete list of Lend Markets and used them to identify which Lend Positions were underperforming? Well here we just inverse the query to list out those "better markets" for your review.
In essence, instead of saying "which positions are underperforming based on current markets?" we're saying "which markets are superior based on my current positions?" so you can check the APYs for yourself.
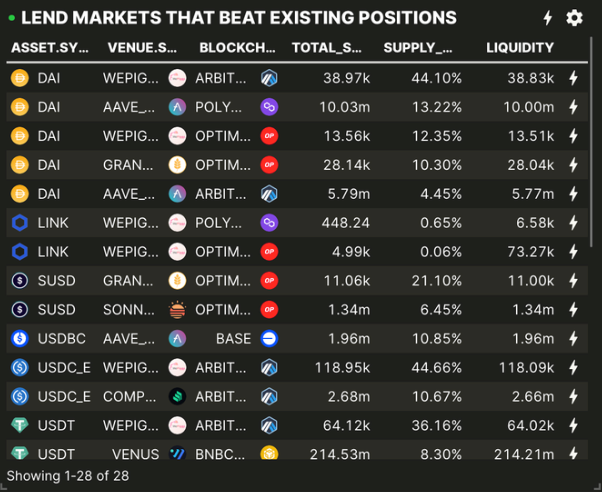
Again using the FILTER function, we first get a list of all the lend markets, then we compare the APY of each one to a list of Lend Positions. If the Lend Market (assuming same asset and blockchain) has a better APY than your equivalent Lend Position (i.e. the first pick from a list of your equivalent positions sorted by APY) then it passes the filter.
FILTER(LEND.MARKETS, VAL.SUPPLY_APY > LIST.FIRST(SORT(LEND.POSITIONS(INCLUDE_ASSETS=[VAL.ASSET], INCLUDE_BLOCKCHAINS=[VAL.BLOCKCHAIN]), "MARKET.SUPPLY_APY", ASC=FALSE)).MARKET.SUPPLY_APY)
Spot Balances Eligible For Lending
Finally, we show your current spot balances eligible for lending. This is a list of all your spot assets for which lending markets exist. In other words, this is another view of 'money left on the table' or balances that are affecting your capital efficiency (whether deliberate or accidental).
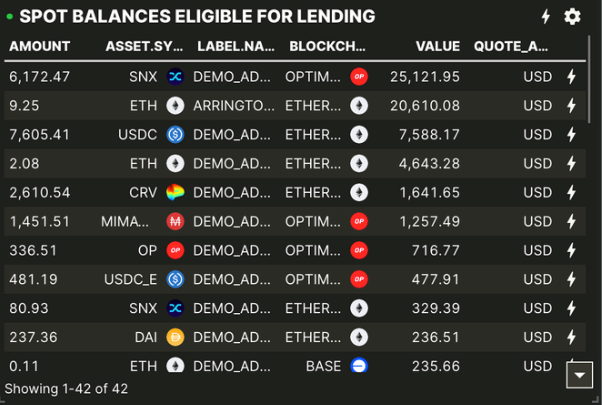
Again using the FILTER function, we start with a list of your spot BALANCES and then apply a condition that a list of Lend Markets for each of your spot balances has to have at least one row (i.e. at least one market exists):
FILTER(BALANCES(), LIST.LENGTH(LEND.MARKETS(INCLUDE_ASSETS=[VAL.ASSET], INCLUDE_BLOCKCHAINS=[VAL.BLOCKCHAIN])) > 0)
Hope this was useful! We'd love to hear any feedback on this template or about anything you've built for yourselves - get in touch!